Modern cloud-native applications generate an enormous amount of metrics every second. Whether you’re running Kubernetes clusters, microservices, virtual machines, or edge workloads, having a reliable monitoring system is essential for maintaining performance, identifying bottlenecks, and ensuring application availability.
Among the most widely adopted monitoring solutions in the cloud-native ecosystem are Prometheus and VictoriaMetrics. Both are powerful, Prometheus-compatible monitoring solutions, but they serve different purposes and excel in different scenarios.
While Prometheus has become the de facto standard for metrics collection, many organizations eventually encounter scalability, storage, and performance limitations as their infrastructure grows. This has led engineering teams to evaluate alternatives that can handle larger workloads while remaining fully compatible with the Prometheus ecosystem.
In this guide, we’ll compare VictoriaMetrics and Prometheus across architecture, scalability, performance, storage efficiency, operational complexity, and enterprise readiness to help you determine which solution best fits your monitoring requirements.
Understanding Prometheus
Prometheus is an open-source monitoring and alerting toolkit originally developed at SoundCloud before joining the Cloud Native Computing Foundation (CNCF). It has become one of the most popular monitoring solutions for Kubernetes and cloud-native applications.
Prometheus works by periodically scraping metrics from configured targets and storing them in its built-in time-series database. Engineers can then query these metrics using PromQL and visualize them through dashboards such as Grafana.
Prometheus provides several important capabilities, including:
- Automatic service discovery
- Powerful PromQL queries
- Built-in alerting integration
- Kubernetes-native monitoring
- Extensive exporter ecosystem
- Active open-source community
For small and medium-sized environments, Prometheus offers an excellent balance between simplicity and functionality.
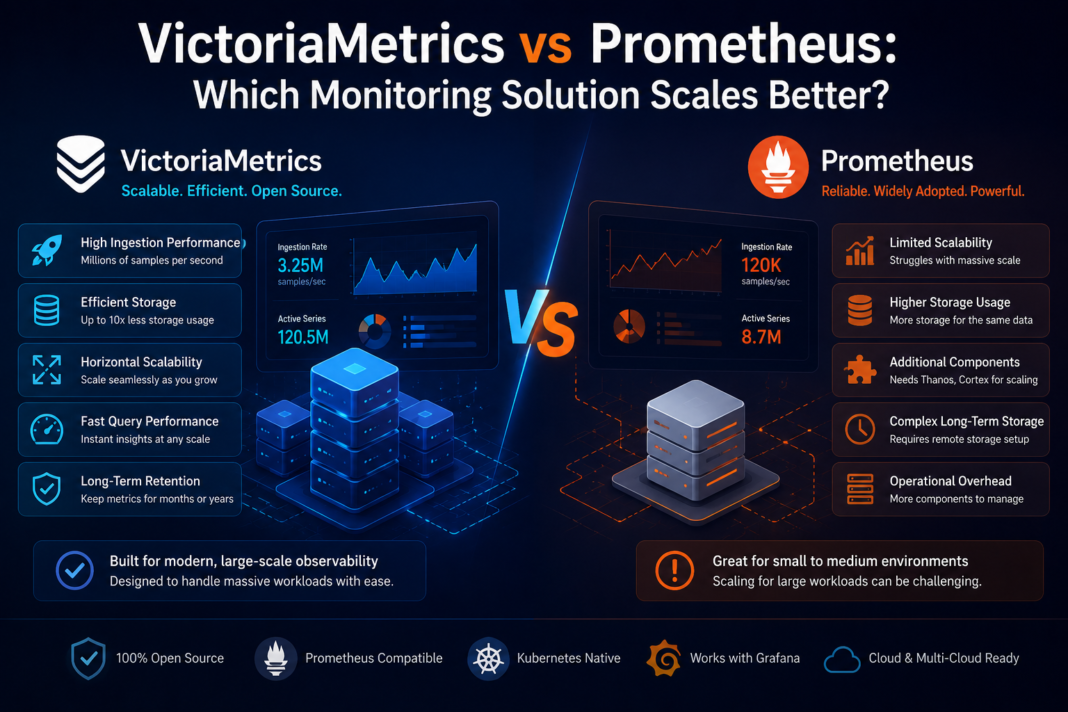
However, as telemetry volumes continue to increase, organizations often need additional scalability and long-term storage capabilities beyond what a standalone Prometheus server was originally designed to provide.
What Is VictoriaMetrics?
VictoriaMetrics is a high-performance, cost-efficient time-series database and monitoring solution built specifically for handling large-scale metric workloads.
Unlike many alternative monitoring platforms, VictoriaMetrics is fully compatible with the Prometheus ecosystem, allowing organizations to continue using familiar tools such as Prometheus exporters, PromQL, Alertmanager, and Grafana while significantly improving storage efficiency and scalability.
Its architecture is designed to support everything from single-node deployments to massive distributed clusters capable of processing millions of samples per second.
Organizations frequently choose VictoriaMetrics when they need:
- Higher ingestion performance
- Better storage compression
- Long-term metrics retention
- Lower infrastructure costs
- Horizontal scalability
- High query performance
This makes it particularly attractive for enterprises operating Kubernetes, multi-cloud environments, SaaS platforms, and large distributed systems.
VictoriaMetrics vs Prometheus: Feature Comparison
| Feature | Prometheus | VictoriaMetrics |
|---|---|---|
| Metrics Collection | ✅ Yes | ✅ Prometheus-compatible |
| PromQL Support | ✅ Native | ✅ Fully Compatible |
| Long-Term Storage | Limited | Built-in support |
| Horizontal Scaling | Requires additional components | Native cluster architecture |
| Storage Compression | Good | Excellent |
| Resource Consumption | Moderate | Highly optimized |
| High Availability | Additional setup required | Supported |
| Large-Scale Deployments | Challenging | Designed for enterprise scale |
While both platforms support modern observability workflows, their architectural goals are quite different.
Architecture Comparison
Prometheus Architecture
Prometheus was originally designed as a single-node monitoring server.
Each Prometheus instance independently:
- Scrapes targets
- Stores metrics locally
- Executes queries
- Evaluates alerts
As environments grow, organizations often deploy multiple Prometheus servers along with additional projects such as:
- Thanos
- Cortex
- Remote storage backends
- Federation
Although these tools provide scalability, they also increase architectural complexity and operational overhead.
VictoriaMetrics Architecture
VictoriaMetrics offers greater deployment flexibility.
Organizations can choose between:
Single-Node Deployment
Ideal for:
- Small teams
- Development environments
- Medium-sized production systems
This deployment remains lightweight while supporting impressive ingestion performance.
Cluster Deployment
Large organizations can deploy clustered VictoriaMetrics with dedicated components for:
- Data ingestion
- Storage
- Query execution
This architecture allows every layer to scale independently without requiring significant changes to existing monitoring workflows.
Scalability Comparison
Scalability is often the deciding factor when organizations compare Prometheus with VictoriaMetrics.
Prometheus Scaling
Prometheus performs exceptionally well for moderate workloads.
However, as infrastructure grows, engineering teams may encounter challenges including:
- Increased storage requirements
- Longer query execution times
- Higher memory usage
- Difficult long-term retention
- Multiple monitoring silos
Scaling typically requires deploying additional components and managing several independent systems.
VictoriaMetrics Scaling
VictoriaMetrics was designed with scalability as a primary objective.
Its storage engine is optimized for:
- Millions of active time series
- High ingestion rates
- Efficient data compression
- Fast analytical queries
- Long retention periods
Because storage is significantly more efficient, organizations can often monitor much larger infrastructures while using fewer hardware resources.
Storage Efficiency
One of the biggest operational costs of monitoring platforms is storage.
Every metric collected consumes disk space. Multiply this across thousands of servers and years of historical retention, and storage quickly becomes a major expense.
Prometheus stores metrics efficiently for many workloads but was not originally optimized for extremely large-scale long-term storage.
VictoriaMetrics, on the other hand, was engineered specifically to minimize storage requirements while maintaining high read and write performance.
Improved compression delivers several benefits:
- Lower infrastructure costs
- Longer retention windows
- Reduced storage expansion
- Better overall operational efficiency
For organizations collecting billions of samples daily, these savings can become substantial.
Performance Under Heavy Workloads
Monitoring platforms should never become bottlenecks themselves.
As telemetry volumes increase, both ingestion speed and query performance become increasingly important.
Prometheus performs well under standard production workloads, but larger deployments may require careful tuning and architectural adjustments.
VictoriaMetrics is optimized for high-throughput environments where rapid ingestion and responsive queries remain essential even as data volumes continue to grow.
This enables engineering teams to investigate incidents quickly without waiting for complex dashboards or analytical queries to complete.
Resource Consumption and Operational Efficiency
As monitoring environments expand, resource utilization becomes a major factor when choosing a monitoring platform. High CPU, memory, and storage usage can significantly increase infrastructure costs, particularly in large Kubernetes clusters or multi-cloud deployments.
Prometheus is lightweight and performs well for many production environments, but resource requirements naturally grow as the number of monitored targets and active time series increases. Organizations with large-scale infrastructures often need to deploy multiple Prometheus instances to distribute the workload, which adds operational complexity.
VictoriaMetrics is designed with efficiency in mind. Its optimized storage engine reduces memory and disk usage while maintaining high ingestion rates and fast query performance. This allows engineering teams to monitor significantly larger environments using fewer infrastructure resources, helping reduce operational costs without sacrificing visibility.
Kubernetes Monitoring
Kubernetes has become the standard platform for deploying cloud-native applications, making Kubernetes monitoring a critical requirement for modern organizations.
Prometheus integrates seamlessly with Kubernetes through service discovery, exporters, and the Prometheus Operator. This has made it one of the most widely adopted monitoring solutions in the Kubernetes ecosystem.
Since VictoriaMetrics is fully compatible with the Prometheus ecosystem, organizations can continue using:
- Prometheus Exporters
- Prometheus Operator
- Grafana
- Alertmanager
- PromQL
- Kubernetes Service Discovery
This compatibility enables teams to improve scalability and storage efficiency without rebuilding their existing monitoring workflows.
Long-Term Metrics Retention
Historical metrics play a crucial role in capacity planning, trend analysis, compliance reporting, and performance optimization.
While Prometheus is excellent for short- and medium-term monitoring, retaining large volumes of historical data often requires integrating additional remote storage solutions.
VictoriaMetrics simplifies long-term retention by providing an efficient storage architecture capable of handling large datasets without significantly increasing infrastructure requirements. Organizations can retain months or even years of historical metrics while maintaining fast query performance.
This makes it easier to analyze seasonal trends, forecast resource usage, and investigate incidents that occurred long ago.
Query Performance
Fast queries are essential during production incidents. Engineers need immediate access to accurate monitoring data to diagnose problems and restore services quickly.
Prometheus delivers powerful querying capabilities through PromQL, one of the most widely used query languages for time-series data.
VictoriaMetrics extends this experience by maintaining PromQL compatibility while optimizing query execution for large datasets. As data volumes increase, fast query performance becomes increasingly important for dashboards, alerts, and historical analysis.
For organizations managing millions of active time series, efficient querying can significantly reduce investigation time during critical incidents.
Operational Complexity
Ease of operation is another important consideration when selecting a monitoring platform.
Prometheus is straightforward to deploy for small environments. However, scaling beyond a single instance often requires additional technologies for federation, remote storage, high availability, and long-term retention.
Managing multiple monitoring components can increase deployment complexity, maintenance effort, and operational overhead.
VictoriaMetrics provides flexible deployment options ranging from lightweight single-node installations to distributed cluster architectures. This allows organizations to start small and scale as their infrastructure grows while maintaining a familiar monitoring workflow.
Migrating from Prometheus to VictoriaMetrics
One of the biggest advantages of VictoriaMetrics is its compatibility with the Prometheus ecosystem.
Organizations can often migrate without replacing their existing monitoring tools.
Existing investments in:
- Prometheus exporters
- Grafana dashboards
- Alertmanager
- PromQL queries
- Kubernetes monitoring configurations
can continue to function with minimal changes.
This compatibility helps engineering teams improve scalability and storage efficiency without disrupting existing operations or retraining users.
When Should You Choose Prometheus?
Prometheus remains an excellent choice if you:
- Operate a small or medium-sized infrastructure
- Need straightforward Kubernetes monitoring
- Require standard metrics collection and alerting
- Have relatively short metrics retention requirements
- Prefer a simple deployment architecture
For many organizations, Prometheus provides everything needed to monitor modern applications effectively.
When Should You Choose VictoriaMetrics?
Organizations experiencing rapid growth or large-scale monitoring demands often benefit from VictoriaMetrics.
It is particularly well suited for environments that require:
- High metrics ingestion rates
- Long-term metrics retention
- Lower storage costs
- Horizontal scalability
- High query performance
- Enterprise-scale monitoring
- Cloud-native deployments
- Multi-cluster Kubernetes monitoring
For engineering teams seeking a scalable monitoring solution, VictoriaMetrics offers an efficient architecture that supports modern observability workloads while remaining fully compatible with the Prometheus ecosystem.
Final Verdict
Prometheus has earned its reputation as one of the most influential open-source monitoring projects and continues to be an excellent choice for many cloud-native environments. Its extensive ecosystem, strong Kubernetes integration, and mature community make it a reliable option for organizations of all sizes.
However, as infrastructures become larger and telemetry volumes continue to grow, scalability, storage efficiency, and operational simplicity become increasingly important. This is where VictoriaMetrics stands out. By combining Prometheus compatibility with high-performance storage, efficient resource utilization, and flexible deployment options, it enables organizations to build monitoring platforms that can scale with confidence.
Ultimately, the right choice depends on your operational requirements, data volume, and growth plans. If your organization is preparing for long-term scalability while maintaining compatibility with existing Prometheus-based tooling, VictoriaMetrics provides a future-ready foundation for modern observability.
Frequently Asked Questions (FAQs)
Is VictoriaMetrics a replacement for Prometheus?
VictoriaMetrics is not necessarily a replacement for Prometheus. Instead, it complements the Prometheus ecosystem by providing highly efficient time-series storage and scalable monitoring capabilities while remaining compatible with Prometheus exporters, PromQL, Alertmanager, and Grafana.
Can VictoriaMetrics use Prometheus exporters?
Yes. VictoriaMetrics is fully compatible with Prometheus exporters, allowing organizations to continue collecting metrics without modifying their existing instrumentation.
Which solution is better for Kubernetes monitoring?
Both Prometheus and VictoriaMetrics work well with Kubernetes. Prometheus provides native Kubernetes integration, while VictoriaMetrics builds upon that ecosystem by offering improved scalability, storage efficiency, and long-term metrics retention.
Does VictoriaMetrics support PromQL?
Yes. VictoriaMetrics supports PromQL compatibility, enabling users to continue using existing queries, dashboards, and alerting rules.
Which platform is better for long-term metrics storage?
VictoriaMetrics is designed to efficiently store large volumes of historical metrics, making it well suited for organizations requiring extended data retention and high-performance querying.
Can I migrate from Prometheus without rebuilding my monitoring stack?
In many cases, yes. Since VictoriaMetrics is compatible with the Prometheus ecosystem, organizations can often reuse existing exporters, Grafana dashboards, Alertmanager configurations, and PromQL queries with minimal changes.
Is VictoriaMetrics suitable for enterprise environments?
Yes. VictoriaMetrics supports enterprise-scale deployments with high ingestion throughput, efficient storage, horizontal scalability, and flexible deployment architectures, making it suitable for large cloud-native infrastructures.
How do I choose between Prometheus and VictoriaMetrics?
If your monitoring environment is relatively small and straightforward, Prometheus may meet your needs. However, if you anticipate significant growth, require long-term metrics retention, or need a highly scalable monitoring solution, VictoriaMetrics offers the performance and efficiency needed to support modern enterprise workloads.